Introduction
If a picture is worth 1,000 words, then a chart (or graph) is worth 10,000 lines of data.
CLIChart provides tools for quick visualisation of tabular data on the command line by generating and displaying charts, for extracting that tabular data from text data (like log files), and for manipulating the tabular data. The emphasis here is on quick - the idea is provide fast ways for you to visualise the relationships in your data.
CLIChart can:
- Display charts in a window, save them to disk (JPEG or PNG), or both
- Accept data in comma- or whitespace-separated formats
- Read data from a file, or have it piped into its standard input
- Display XY line charts, with the X axis based on dates, times or values. The Y axis must be simple values (integer or decimal)
- Be used interactively, or driven via scripts
- Generate summary data based on counts, averages, minimum, maximum of input fields
- Generate summary data based on discrete values
- Generate aggregates and histograms from tabular data
- Merge tabular data from multiple sources
- Operate in CLI server mode, generating 1 or more charts based on commands passed via standard in (either from another script, or from a command file).
Probably the easiest way to get a feel for what CLIChart can do, and whether it’s of interest to you, is to look at the Quick Start Guide.
CLIChart was originally developed for interactive charting of data from server log files, so its primary audience is probably software developers and system administrators.
The project consists of the following tools:
- clichart - generates charts from tabular data
- cliserverlib - a Python driver for the CLI server mode of clichart
- linestats and discretestats - generate tabular data from logs or other text data
- mid - extracts parts of files or other data
- merge - merges tabular data from 2 or more sources
- aggregate - aggregates (or summarises) data from other tabular data
- histogram - generates histograms (frequency spread) from other tabular data.
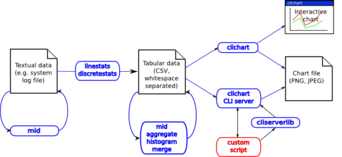
Tools in the CLIChart package - click for the full-sized diagram
NOTE: CLIChart is no longer under active development.
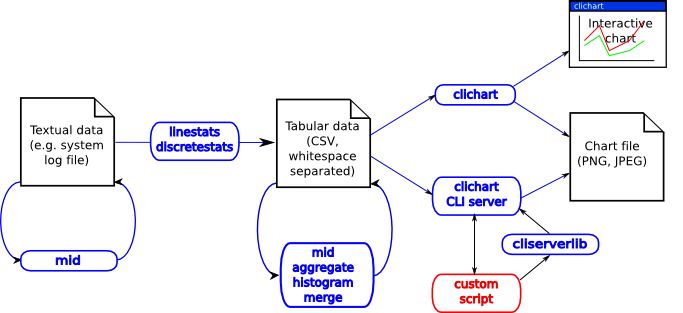
Sample Output
Here’s a sample chart generated by CLIChart, from a CSV file extracted from data in a system log (click the image to see the full-size chart).
The command-line required to generate the chart was:
clichart -fcl 0,1,2,3 -t "Processing of Foo Requests - 12 Feb 2006" \
        -y "Requests per minute"  system.log.2006-02-12.fooRates.csv
And bear in mind that most of the command-line is titles and other prettiness, so it’s simple and quick.
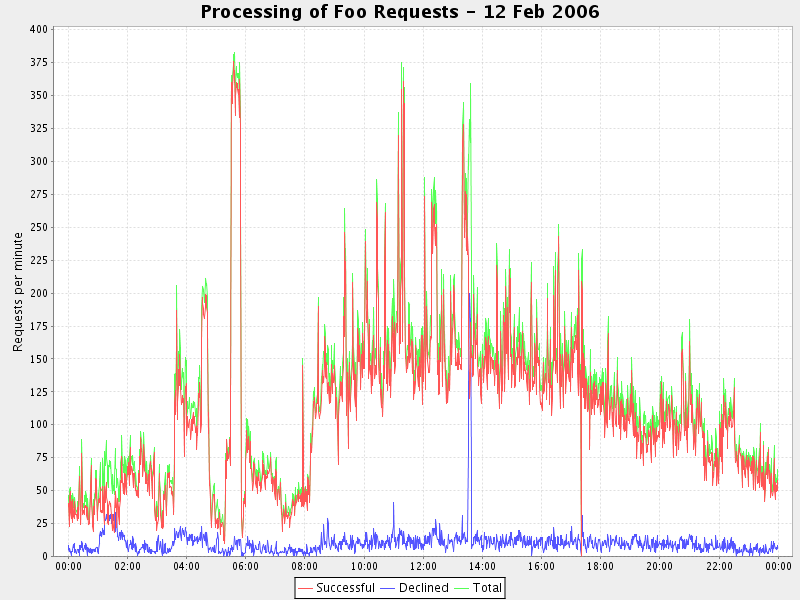
Here’s a more involved chart, including a second Y axis displayed as a bar.
Modes of Operation - Using CLIChart
There are three main ways in which you might use clichart (the charting tool in CLIChart):
| Automated: | In this mode, you have already prepared the tabular data, and you want to use clichart to create and save charts without human intervention. You can call clichart from shell scripts or batch files, or directly from Java if you like. The CLI server mode of clichart is made for such use, since it makes the process much more efficient. We use this mode to automatically generate charts for summary web pages from the daily logs of a number of systems we operate - things like transaction rates over time, memory and thread use every minute etc. |
|---|---|
| Interactive with pre-existing data: | |
| As in the automated mode above, the tabular data already exists. Your aim is to use clichart to look for patterns or relationships in it. You feed the data to clichart on the command line, specify how it should build the chart, and then view the results in a window. | |
| Interactive without pre-existing data: | |
| In this case, you’re examining some data source that isn’t tabular, e.g. a server log file. You want to use clichart to examine it, e.g. to look for the causes of last Thursday’s spectacular system meltdown. Before you can chart the data, you first need to extract the appropriate data from the source into a tabular form, and maybe massage it. This tends to be a highly iterative process - create a command line to extract and chart some data from the log, then based on the look of the chart modify the data extraction command line and repeat. The Quick Start Guide has some good examples. | |
When you have pre-existing data you can use a spreadsheet to do your charting - clichart will be faster, but the spreadsheet will be more flexible. But clichart really comes into its own for the first and third modes.
When you’re mining a log file (the third mode), you’ll need to use tools to extract and massage the data before charting it - this is what linestats, discretestats and mid are for. As well, you may not know in advance exactly what data you’re looking for (typical when investigating a system problem), so this tends to be an iterative process: use a command line to generate a chart, examine the chart, tweak the command line to extract better or different data, and repeat.
Tool Documentation
clichart
clichart is the main program, used for generating, displaying and saving charts from tabular data
cliserverlib
cliserverlib is a Python driver for the CLI server mode of clichart. Use this when you have a Python script which needs to generate more than one chart (or when you want to do the same in some other language - this will provide an example of how to do it)
linestats
linestats is a powerful utility to generate statistical data from textual input such as a log file. It’s particularly useful for extracting rates of occurrence of particular messages, e.g. transactions per second, URL accesses per minute, or for accumulating statistics (minimum, average, maximum etc.) of different values per minute.
discretestats
discretestats is another utility to generate statistical data from textual input. It differs from linestats in that its purpose is to count the occurrence of each discrete value in a field, and group these by key value. A good example is extracting the number of info, warning and error messages per minute in a log.
mid
mid is the steroidally-enhanced child of the venerable Unix head and tail utilities. It’s there to extract ranges of lines from a file in the most convenient way possible. It’s most useful to pull out parts of the data, in order to drill into the detail.
merge
merge is used to merge tabular data from 2 or more files, based on key values in each file. A typical use is to combine data from 2 sources so they can be shown on the same chart.
aggregate
aggregate is used to aggregate or summarise existing tabular data - you end up with 1 line of summary data for each input file. A typical use is generating data to show long-term trends, where you already have a number of tabular data files covering shorter periods.
histogram
histogram is used to generate a histogram (or frequency representation) of a single column from existing tabular data. You specify how many frequency intervals to split the range into, and the output is one line per interval, including the number of data values falling within that interval. A typical use would be to generate a chart showing the spread and frequency of response times from a server.
Using clichart as a Library
If you’re using Java (or a scripting language running in a JVM, e.g. Jython, JRuby, Groovy etc.), then you can use clichart as a library.
You can generate the Javadoc for clichart by checking out the source code, and running:
ant javadoc
The Javadoc will be under target/java/javadoc/.
Alternatively, if you’re using Python, you can use cliserverlib, particularly if you want to generate more than one chart.
Contacting Me
My name’s John Dickson. I’m an architect for server-side Java systems, and I seem to have spent far too much of my life looking at logs trying to understand what the system was doing at particular moments. CLIChart grew out of that experience.
You can get in touch with me at the email address: ‘captsens at gmail dot com’. I’d love to hear whether CLIChart scratches your itch, and if not why not.
Thanks and Acknowledgements
CLIChart uses several great open source libraries to do its job:
- The amazing JFreeChart, to generate and display the charts (LGPL)
- The Apache Commons CLI library, for parsing the command-line arguments (Apache licence)
- The JavaCSV library for parsing CSV data (LGPL).
Thanks to all the developers involved for making their work available to others.
Licence
CLIChart is licenced under the GNU Lesser (or Library) Public Licence. See the LICENCE.txt file for details.